
Page 78 - Digital_Kids_5
P. 78
Algorithm to Calculate Sum and Average
This algorithm demonstrates a more computational process, taking numerical inputs and
performing calculations to produce an output.
Step 1: Read first Number (A).
Step 2: Read second Number (B).
Step 3: Read third Number (C)
Step 4: Find the sum of three numbers (A+B+C).
Step 5: Find the Average (A+B+C)/3.
Step 6: Display Average.
Step 7: Stop.
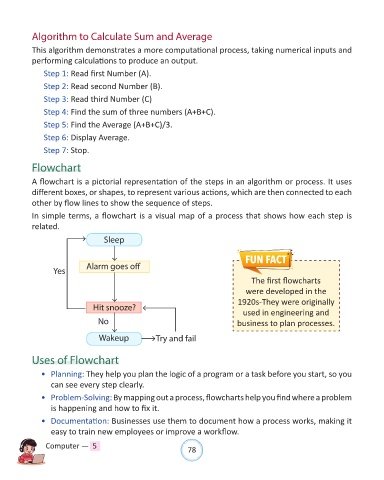
Flowchart
A flowchart is a pictorial representation of the steps in an algorithm or process. It uses
different boxes, or shapes, to represent various actions, which are then connected to each
other by flow lines to show the sequence of steps.
In simple terms, a flowchart is a visual map of a process that shows how each step is
related.
Sleep
Alarm goes off
Yes
The first flowcharts
were developed in the
1920s-They were originally
Hit snooze?
used in engineering and
No business to plan processes.
Wakeup Try and fail
Uses of Flowchart
• Planning: They help you plan the logic of a program or a task before you start, so you
can see every step clearly.
• Problem-Solving: By mapping out a process, flowcharts help you find where a problem
is happening and how to fix it.
• Documentation: Businesses use them to document how a process works, making it
easy to train new employees or improve a workflow.
Computer — 5 78